
What was a terrible lead yesterday, is a solid opportunity today. What happened?!
Businesses change. All the time. Subtle shifts, like the hire of a senior-level employee, or earth-shattering changes, like a merger or a funding round, create a window of opportunity. The types of changes that lead to a sales opportunity are commonly known as trigger events.
Trigger events are your sixth sense in sales prospecting, but how can you distinguish between meaningful company changes that create new sales opportunities and noise? How do you turn data into actionable insight?
That's a good question. The trick is to figure out what happened at a company right before they booked a meeting with you, requested a demo, or became your customer. Tune into the right channels and detect relevant company changes and you’ll contact a prospect when they need it most.
Here’s how you create a simple dashboard to visualize the most effective trigger events. You'll only need a spreadsheet and trigger event data feeding into your CRM.
🚨 We've included a handy template to help you get started.
How to use trigger events to track new sales opportunities [template included]
Step 1. Make a copy of the template
Before you get started, you need to make a copy of the dashboard template on your Google Drive.
To make a copy, click here to open up the template. Then go to File > Make a copy.
Step 2. Figure out what you want to measure
Today, with the abundance of business data available for any and every company out there, sales technology can inform you of any company change in real-time. So, in theory, you can build your dashboard to visualize any number of trigger events, but you probably want to focus on just a few key occurrences.
Before you start visualizing trigger event data, ask yourself two questions:
- What's the result you want to measure?
- Which data points do you want to track?
The idea is to keep your dashboard focused on a specific objective. For example, a common outcome of acting on a trigger event is a booked meeting. Did this particular trigger event lead to a booked meeting?
If you're managing a sales team, you can also create a dashboard to track each rep's sales activity. When the whole team acts on the same trigger event, who’s booking the largest number of meetings? This visualization will help you uncover other problems in the sales process.
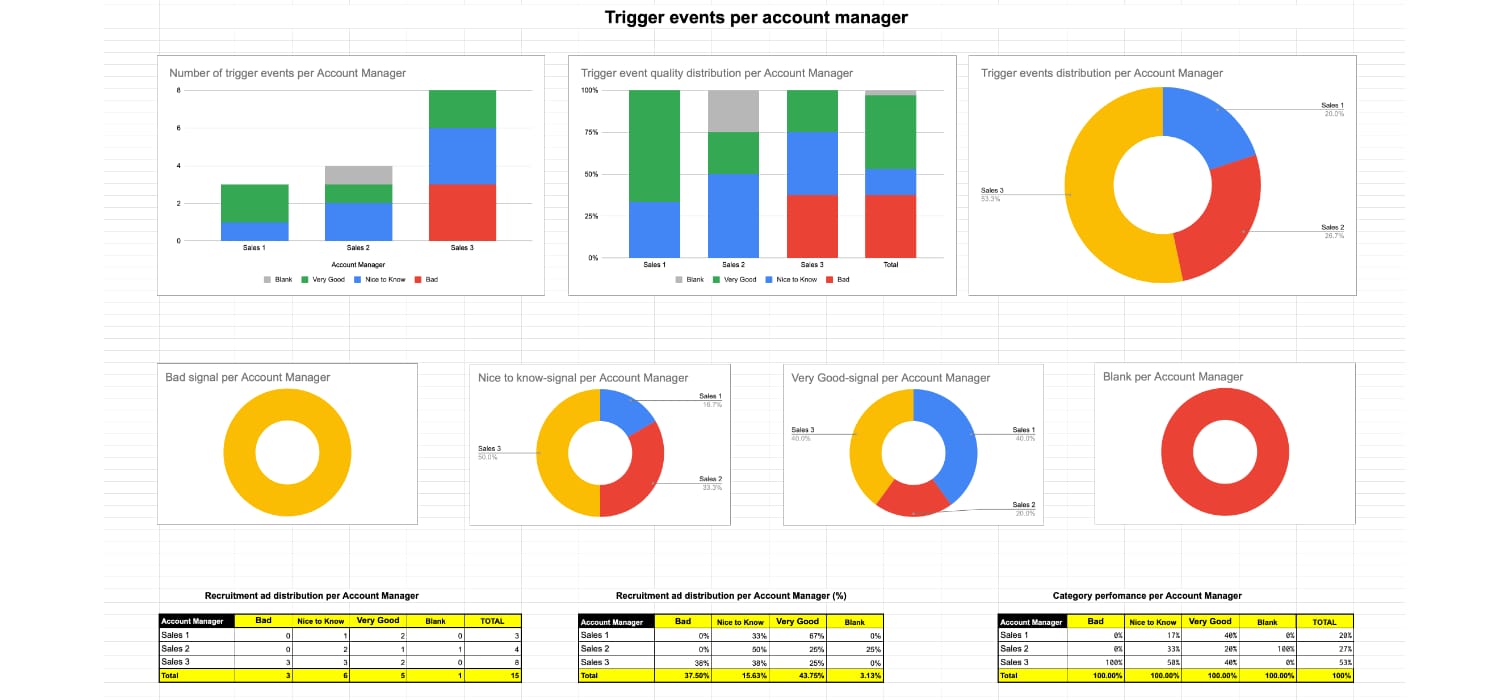
The dashboard also helps you track your team's sales activity based on trigger events.
Step 3. Fetch the data
Now that you've established the key objective, you need to fetch the appropriate data and feed it into the spreadsheet. Depending on your sales tools, there are different ways to do this.
The simplest way to compile the information necessary to build your dashboard is to manually export the data from your CRM in CSV format and import it into a spreadsheet. This process only takes a few minutes, but you will need to repeat any time you want to update the dashboard. That’s not too convenient, but it’s enough if you only want to conduct monthly or quarterly reviews. But if you’re managing hundreds of accounts and want to stay on top of any change at any time, it’s going to be difficult.
The solution? Automation.
Many CRM platforms have features to import, edit, and sync data with Google Sheets (or Excel). You can do it with Salesforce data, And, with Dynamics, too. Other CRM, like HubSpot and Pipedrive might be a bit trickier to set up, but there are workarounds. Alternatively, you can use custom from different vendors, but those come with a price tag.
Once you’ve supplied the data, you’ll have a dashboard that is automatically refreshed. Pretty cool.
☝️ One thing, for this dashboard to work, you’re CRM records must store enough data to draw reliable insights. Consider regular data enrichment to be sure to stay on top of changes happening in your CRM accounts.
Step 4. Select your trigger events
Next up—select the trigger events you want to evaluate. Usually, you want to keep an eye on the company attributes that match your ideal customer profile.
 List the trigger events you're evaluating. Later, you'll assign the score.
Once you've selected your trigger events, add the data into the 'Base - Data' tab. At the very least, you want to have information on the owner of the account, the company, the trigger event, and the quality of trigger event (signal quality). But if you've connected the sheet to the CRM, you can add many more data points to follow.
Financial data is a common source of trigger event information, but any data point can be of interest to your sales team. Let's illustrate this with an example: A SaaS company that has developed an onboarding employee platform wants to know when its target accounts experience a 20 percent, or more, increase in revenue. Typically, higher revenue leads to a hiring boost. The release of a new financial statement is, therefore, an important trigger event to track.
There's one caveat. Financial statements are a very popular trigger event. Many providers will call and email a company the day after the release of new financial information. It makes sense to stay on top of less obvious trigger events. If the same SaaS company specializes in onboarding retail employees, news on the opening of a new store will likely be an interesting trigger event.
Here, we have a list of the most common trigger events.
Step 5. Set a timeframe
Be patient. It'll take some time to figure out what trigger events are leading to better results. Your dashboard can visualize information in real-time, and that's beneficial if you have an extensive target list. If not, it's fine to check this dashboard weekly and see what trigger events are influential.
Step 6. Evaluate results
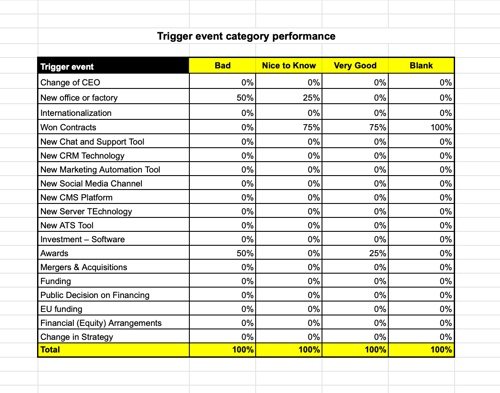
After some time, the dashboard will start revealing the quality of the trigger events you chose to test. Have your team qualify each trigger based on their success. You can use a simple scale: 1) Good, 2) Nice to know, or 3) Bad.
You can use any criteria to estimate the success of a trigger event. In short, you want to evaluate: Did the deal move forward?
Here, we recommend a combination of quality distribution per trigger and trigger distribution per quality. For example, when we evaluate the trigger event “New CEO”, we look at the distribution of Good / Nice to know / Bad. Then, we check all the Good / Nice to know / Bad of every trigger event we’ve tracked and see how they compare to each other. Which one performs better?
Step 7. Discard trigger events that don't bring opportunities
Not every trigger event will indicate a great time to contact a company nor will it lead to a booked meeting. Some trigger events will actually tell you the opposite: when you shouldn't reach out, or when acting on specific trigger events doesn't have any impact in your sales results.
Over to you
A sale starts with a change. Trigger events are an excellent tool to uncover new opportunities and optimize your timing.
By visualizing your data, there are a lot of valuable insights you can get. A simple dashboard like the one we've presented here will help you keep track of the data and document what works and what doesn't.
Still unsure on how to optimize your sales process around trigger events? Book a call and let us show how.