
The International Data Corporation (IDC) forecasts that the yearly global spending on digital transformation will reach $2.8 trillion in 2025. For the uninitiated, digital transformation refers to the adoption of digital technologies by a company, and it is generally pursued in the hope that these newly-adopted digital technologies will provide efficiency gains and customer intimacy.
The aforementioned statistic clearly highlights that the demand for digital technologies that improve existing business processes is, to say the least, significant. The growing demand for digital technologies presents an unprecedented opportunity for companies that are able to provide products or services that help businesses achieve these digital transformations.
Of course, life is never completely without its challenges, and a difficulty for providers of such products or services lies in identifying companies that use, or don’t use, certain digital technologies. Fortunately, there is something that can help such companies overcome such a challenge: Technology data.
What is technology data?
Here at Vainu, we use the term “technology data” to refer to information about the web technologies that a company is using. Typically, these technologies will be divided into subsets that best describe the technology’s use case. For example, our technology data can tell you whether a company uses a “Reservation” technology and, if they do, which specific system it is that they use, e.g. OpenTable, a popular online restaurant-reservation service.
How can technology data help me?
Simply put, technology data can help you find your best-fit customers more effectively. The use case is straightforward for an organization that offers a solution that is contingent on the use of modern technologies or certain technical systems. For example, an organization that offers a “Marketing Automation” technology might be looking for companies that currently use a competitor’s solution, which they believe their technology is superior to.
Alternatively, the organization might be interested in companies that aren’t currently using marketing automation software but have a high Digitalization Index score. Digitalization Index is a term that refers to how digitally advanced a company is, based on the number of technologies that it uses. So, this organization might be on the lookout for companies that already use many technologies, but haven’t got around to implementing a marketing automation tool yet.
Further, while the specific technologies used by a potential customer might not be equally interesting for all, a company’s use of technology can still act as a useful indirect indicator for something else—a company’s willingness to try new things. For example, an organization that offers services related to mental coaching or communication training might discover that companies with a higher Digitalization Index are more likely to become and stay customers, the reason being that these types of companies are generally more open to trying new initiatives that have could potentially lead to efficiency gains.
Vainu's Technology data
Now knowing what technology data is and how it can be helpful, you might want to know more about what kind of technology data is available. For that reason, we've decided to demonstrate some of the technology data that Vainu provides its customers. In case it wasn’t obvious, we don’t live in a perfect world, and we can by no means even begin to guarantee that we will be able to find every technology that a company uses or every company that uses a specific technology. However, what we can do is increase the chance of you finding the companies you’re looking for. Having direction is important in life, and having an idea of where to go will be much more productive for you than searching blindly.

Nordic company database
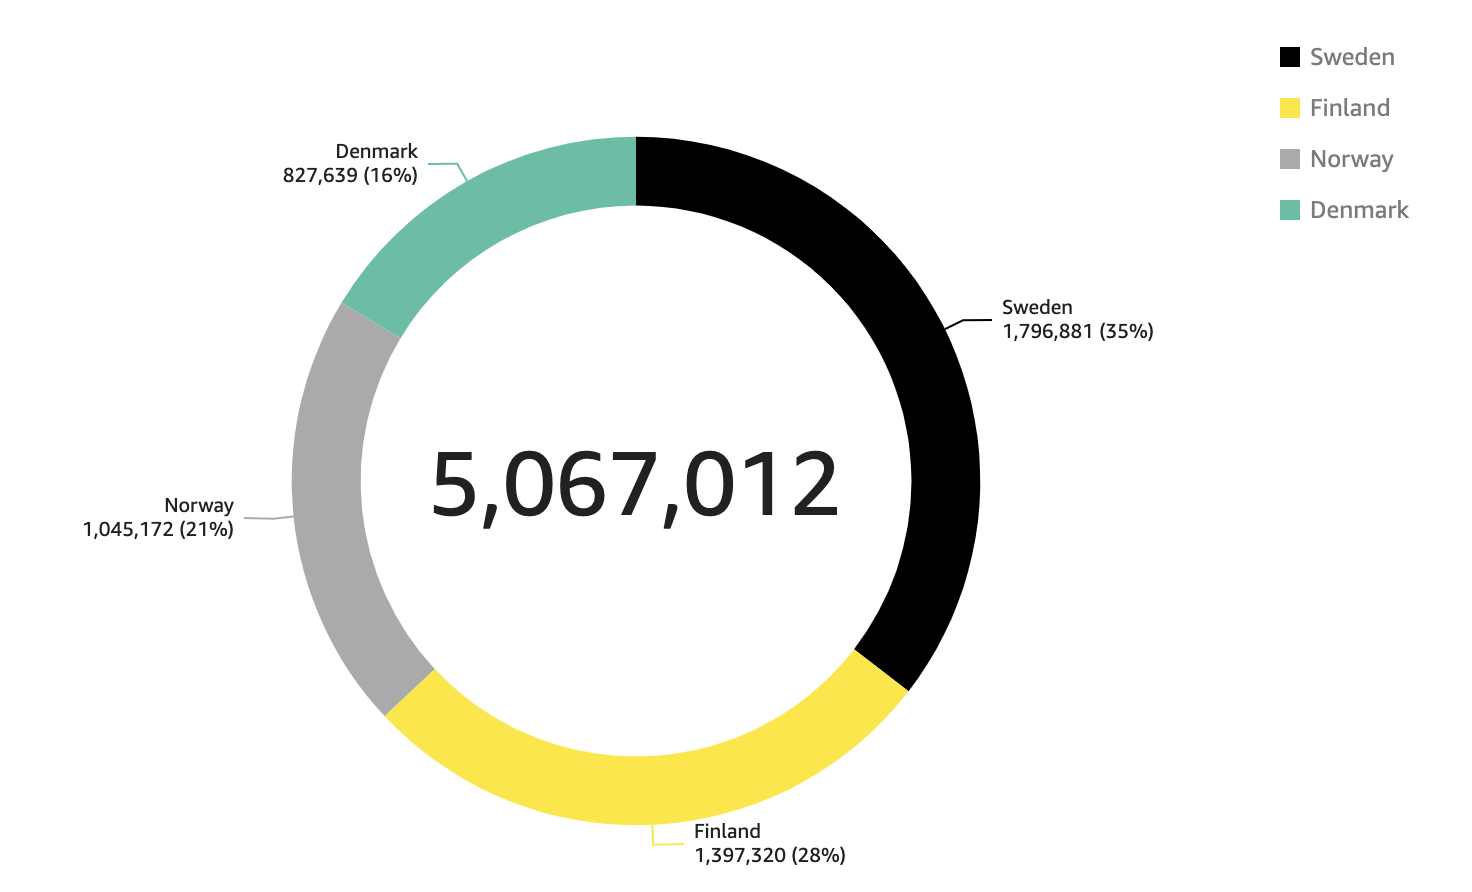
Our Nordic database is made up of four independent country databases, which collectively contain 5,067,012 companies. By gathering, analyzing, and compiling data from millions of online sources, Vainu is able to create comprehensive and meaningful company profiles for each and every one of these companies. A typical company profile includes industry, revenue, number of employees, HQ location, and many more meaningful data points, such as technology data, which we will be focusing on showcasing here.
Technology subsets
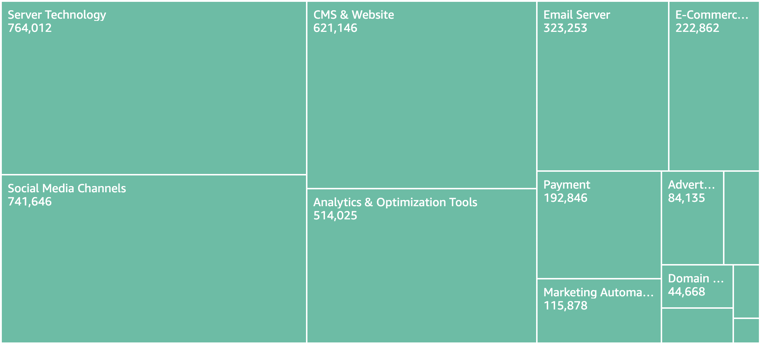
It is by analyzing website content that Vainu is able to identify the technologies that a company is using. The detectability of technologies will obviously vary depending on whether the software is present in the website code. Once a technology has been detected in the website code, Vainu identifies it and associates it with the relevant technology subset, as illustrated in the data visualization below. As you can see, the “Server Technology” subset is the largest, with 764,012 of the companies in our Nordic database being identified as using such a technology.
To further demonstrate the depth of Vainu’s technology data, we’ll be taking a closer look at two of these subsets with a focus on the Nordic database.
Analytics & Optimization Tools
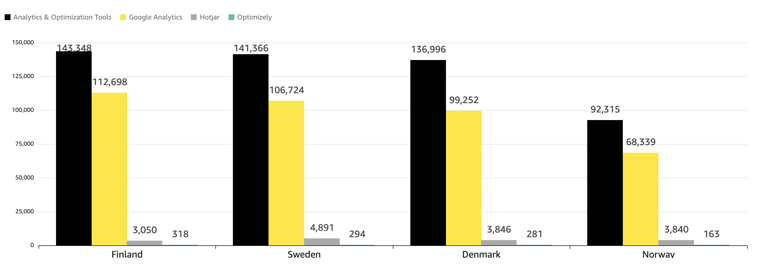
Our “Analytics & Optimization Tools” subset encompasses tools that are used to test, analyze, and optimize marketing initiatives and website behavior. While a comparable number of companies have been identified to use such a technology in Finland (143,348), Sweden (141,366), and Denmark (136,996), Norway (92,315) is lagging behind, as can be seen in the visualization below.
Also evident in the visualization below, Google Analytics reigns supreme in this subset. Of the companies identified as using an “Analytics & Optimization Tools” technology, an average of ~75% were found to be using Google Analytics. This is a substantial difference in adoption rate compared to Hotjar, the popular behavior analytics tool, and Optimizely, the digital experience platform, whose average adoption rate across the four countries were ~3.14% and ~0.2% respectively.
Payment
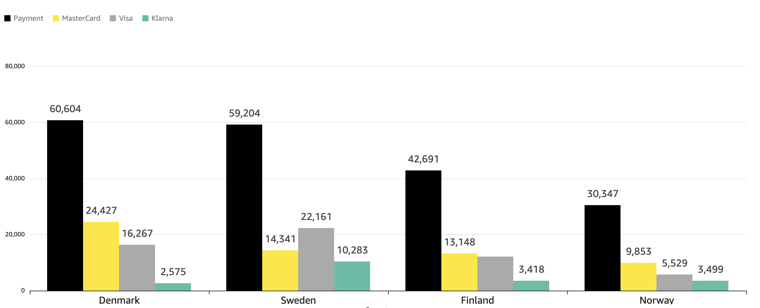
Our “Payment” subset encompasses tools that are used to process online payment transactions and contains a variety of popular payment processing providers, such as MasterCard, Visa, and Klarna. In our Nordic database, there are a total of 192,846 companies that have been identified as using a technology that are within the “Payment” subset.
Of these 192,846 companies, 60,604 (31.43%) are located in Denmark, 59,204 (30.70%) in Sweden, 42,691 (22.14%) in Finland, and 30,347 (15.74%) in Norway. The visualization below offers a breakdown of the number of the companies in the “Payment” subset in Norway, Denmark, Sweden, and Finland that use MasterCard, Visa, and Klarna.
Next steps
Hopefully, you've learnt a little about what technology data is, how it can be valuable for B2B companies, and the wide variety of technology data points that are available to you.
If the blog has sparked an interest, then please feel free to contact us via our chat or sign up for a free trial. Our data experts would be happy to help you learn more about technology data and the various ways in which you could gain value from having it at your disposal.